A New Foundation For User Studies
TLDR:
Roles and Responsibilities:
- UX Researcher
- Lead Designer
Project Context:
- Two weeks (one sprint) in January 2022
- Jr. Product Designer at American Addiction Centers
Tools Used:
- UserZoom
- Notion
- Jira
Problems Faced
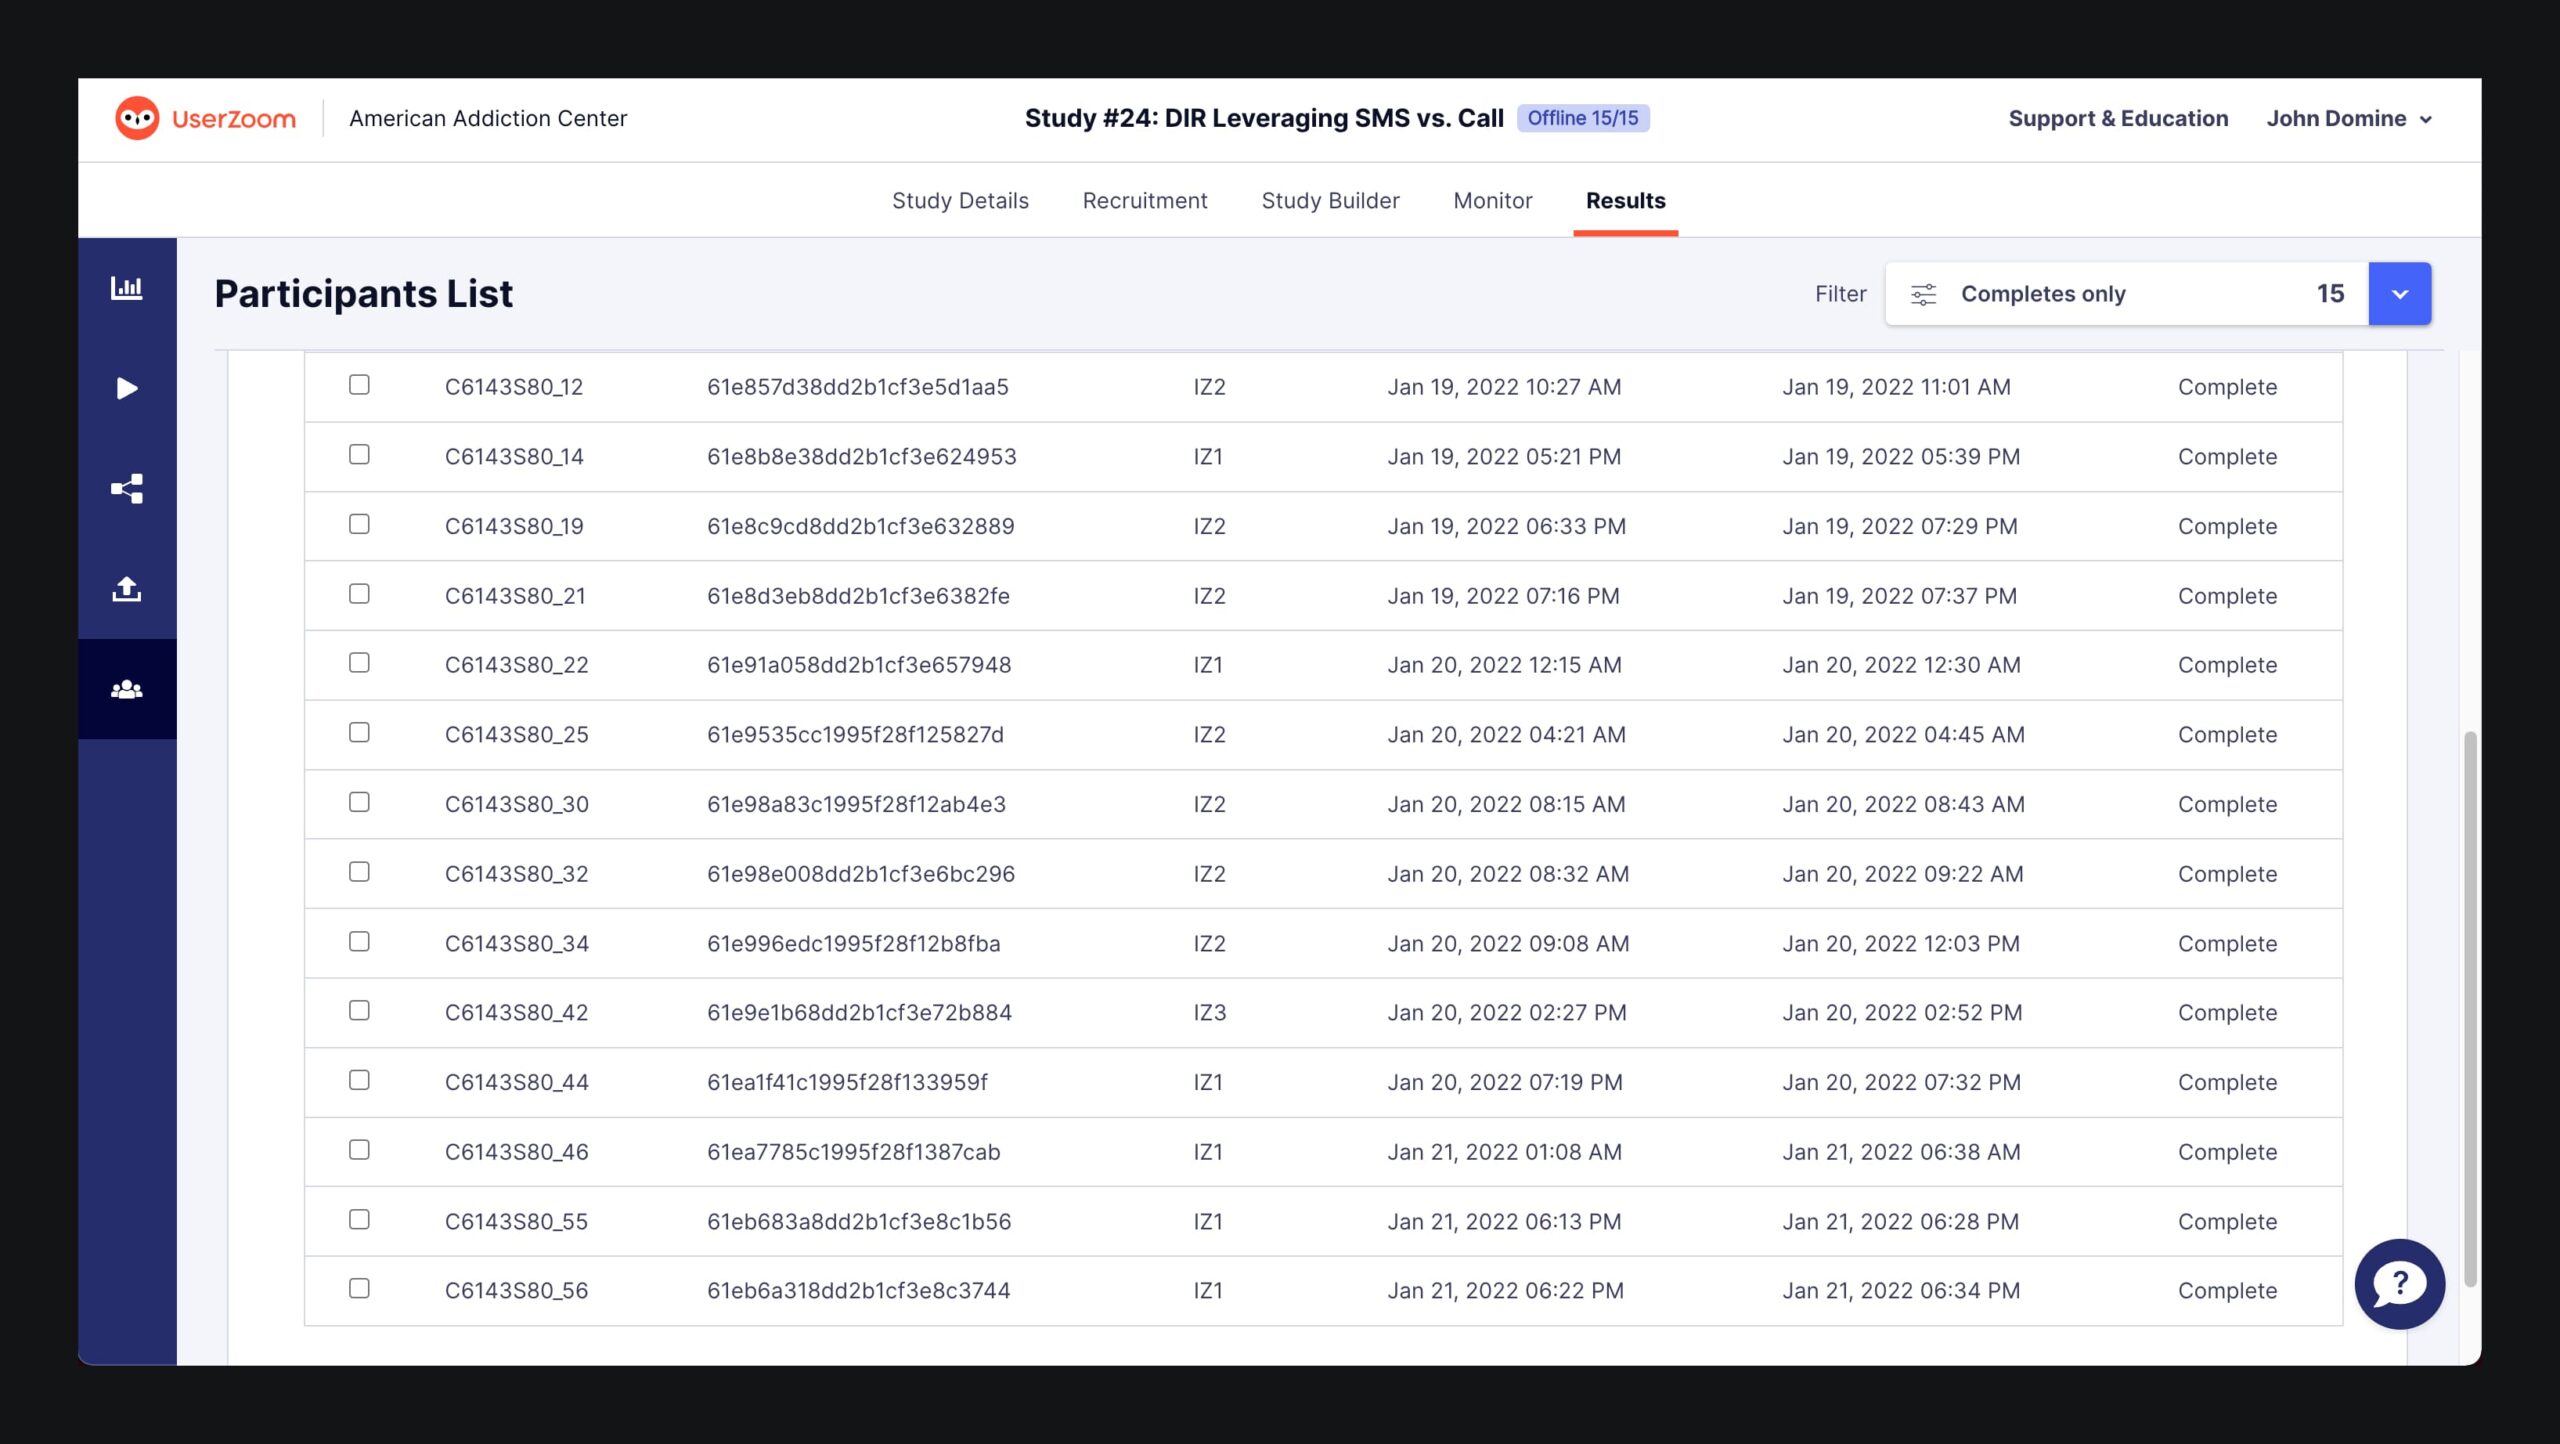
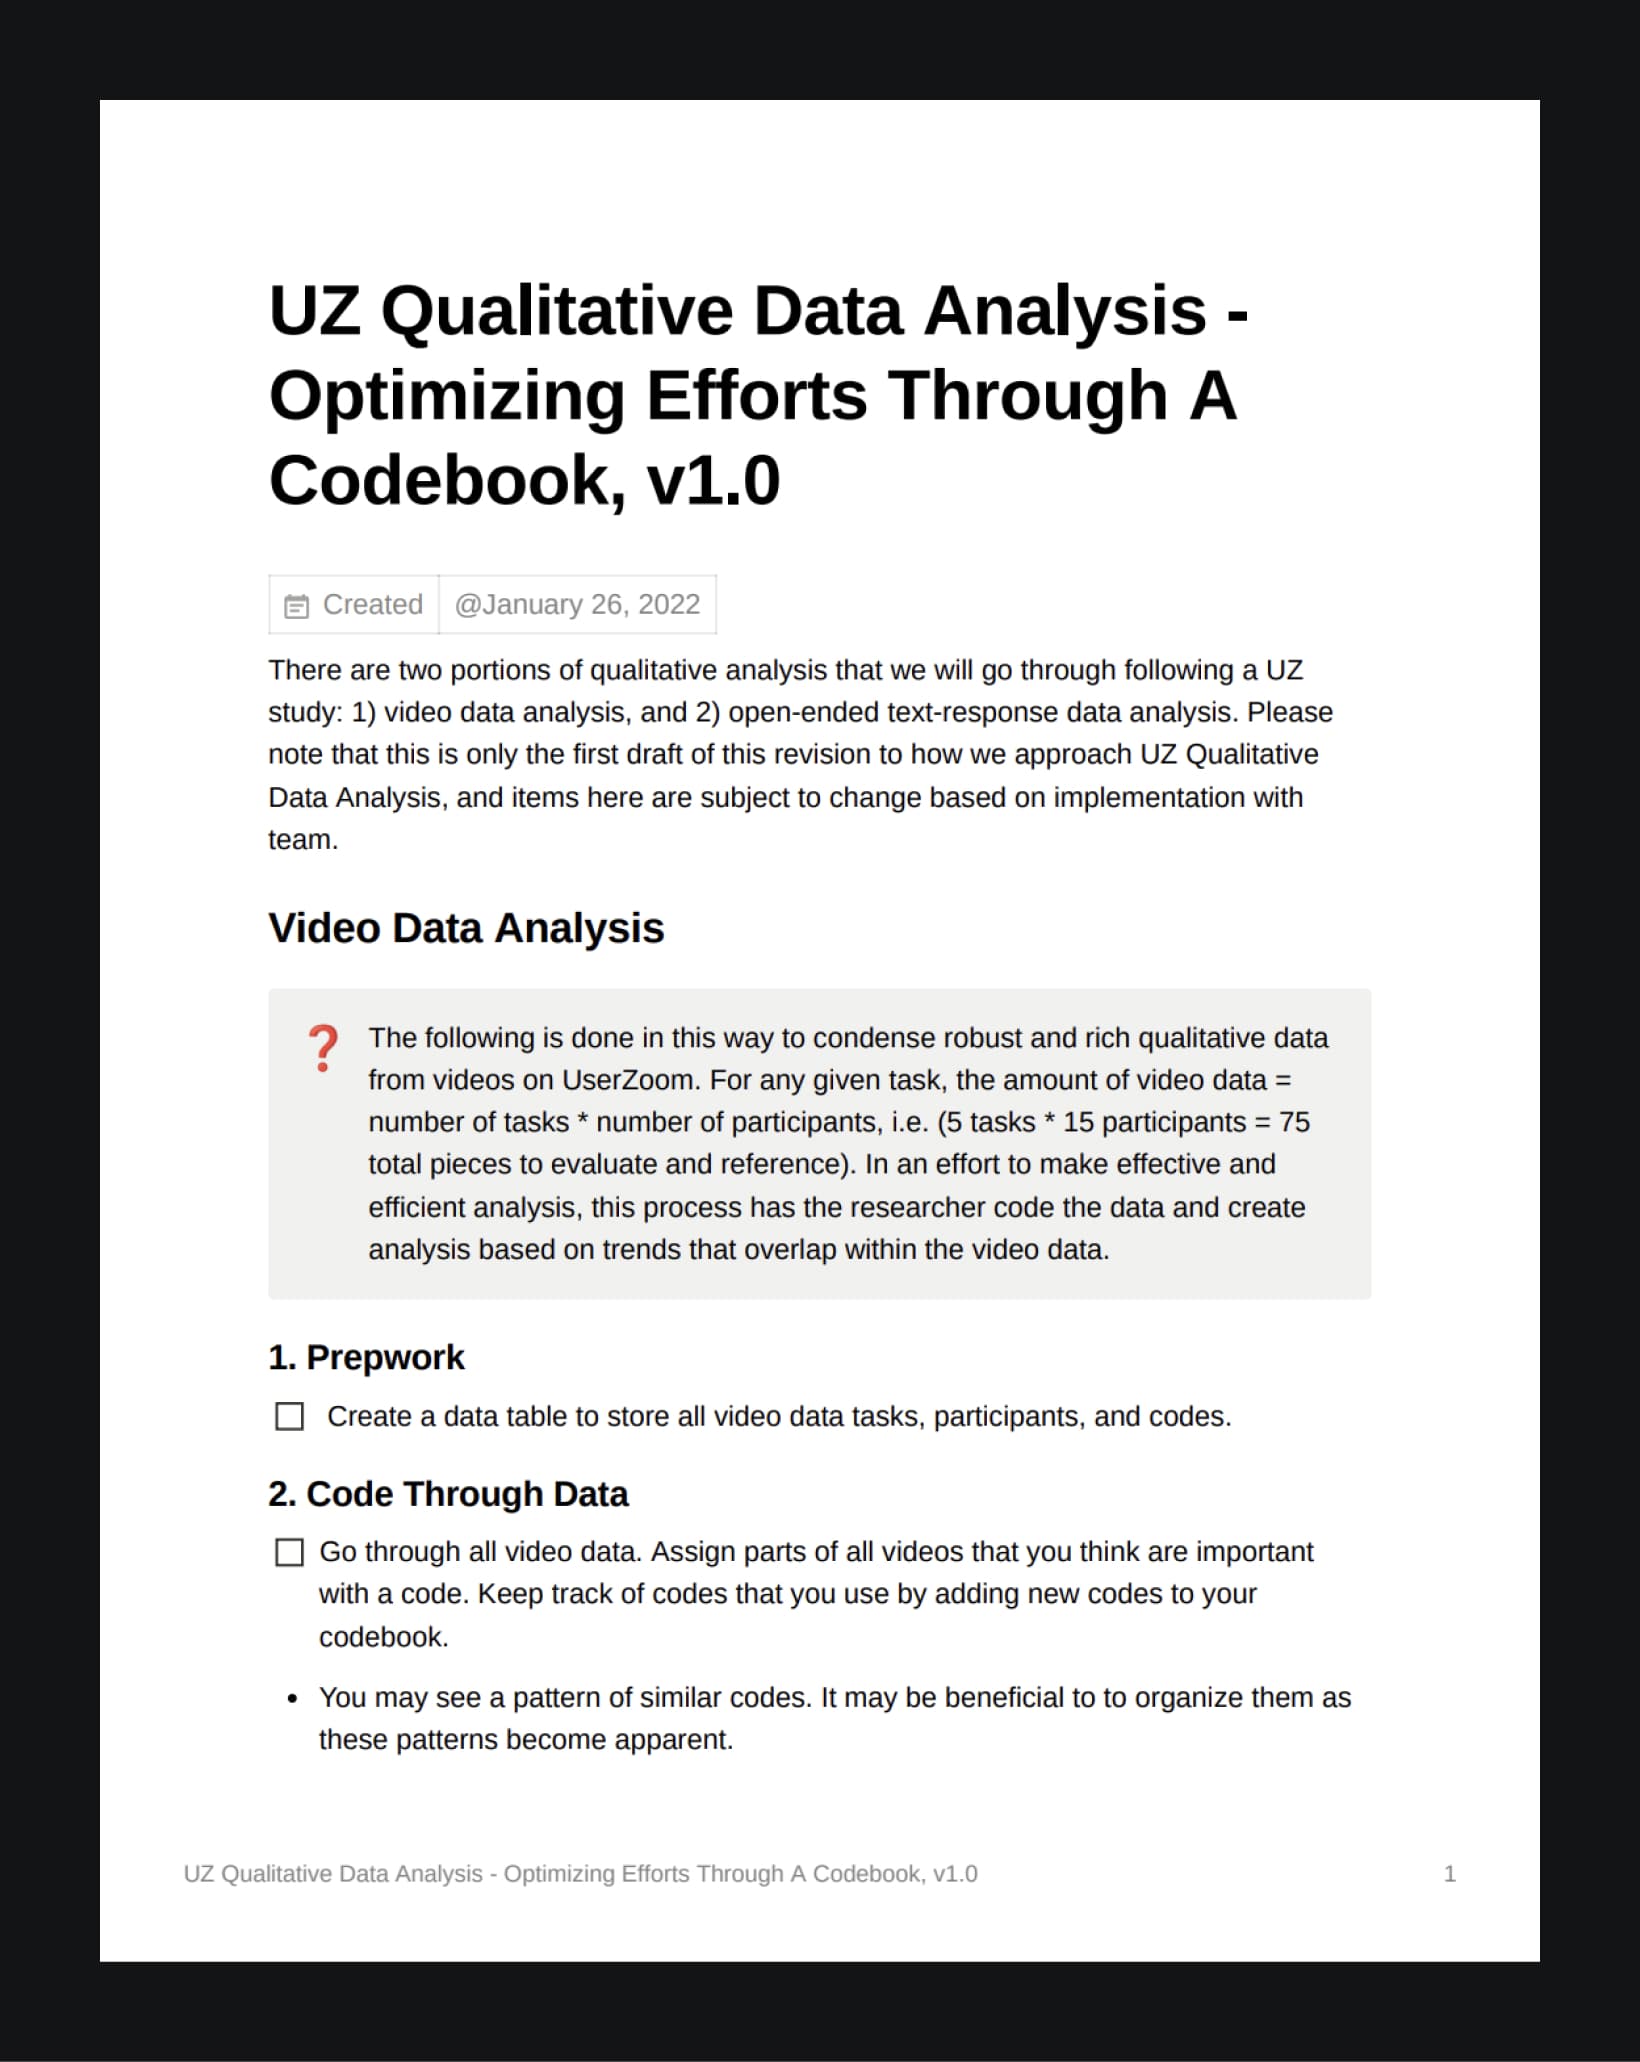
We had been doing user studies through our vendor UserZoom for about half a year, but only started to realize that we weren't using it to it's fullest potential during Q1 2022.
User studies are excellent ways to gather data from our users: we give people within our user base a controlled scenario to help us understand different perspectives and feedback to help validate or improve our products.

We as a team decided that the studies we've been conducting had an abundance of valuable data, but weren't being utilized efficiently.
- Each designer had a different way of analyzing the studies that they ran, so it made it hard for stakeholders such as Product Owners to go back and come to these same conclusions without spending time reviewing video data.
- Despite the many insights and takeaways that we had, there would not be many actionable items that came from these studies.
- One study would often lead to another study to answer a question from the first study, leading to a huge sink in resources.

To put into perspective how long it takes to analyze a study: each study took around 15 minutes, and there were minimum 15 participants. Studies were split into different tasks, so each video may have up to 5 different tasks. 15 participants x 5 tasks = 75 individual pieces, 15 participants x 15 minutes = 225 minutes. This doesn't account for the amount of time rewinding the videos to understand what a user said, or the written responses that are separate from the video data.
To put into perspective how long it takes to analyze a study: each study took around 15 minutes, and there were minimum 15 participants. Studies were split into different tasks, so each video may have up to 5 different tasks. 15 participants x 5 tasks = 75 individual pieces, 15 participants x 15 minutes = 225 minutes. This doesn't account for the amount of time rewinding the videos to understand what a user said, or the written responses that are separate from the video data.
During my sprint where my study had just wrapped up and the data was ready to be analyzed, I thought it was the perfect time to try and optimize this process for our team, so I reached out to my design manager and got the green light.
Understanding the Problem
Taking a step back and trying to see the big picture, I considered how to address the problems that we had:
- How might we make it easier for anyone to understand the data that a designer analyzed?
- Make it intuitive, data should be accessible.
- How might we ensure that valuable action items come out of these studies more often?
- Make it a goal going into the study to come out with actionable steps for improvement.
- How might we make it more likely that a study will address everything that we want and prevent duplicate efforts?
- Make it thorough, our questions should cover all the bases, with little room for error.
To solve this problem, we need to make a new streamlined process that is intuitive, action-item-oriented, and thorough. To identify this, I would need to learn more about how to condense a large amount of qualitative data from our user studies.

Research
I didn't know much about qualitative analysis until this project, so I took a deep dive online.
I came across this brilliant summary from joegrayux, about his process on how he coded through a dataset of a year's worth 5000+ text comments. TLDR: Joe had created rough codes that would become more refined and then put into a codebook with a framework to easily understand the data.

I also looked into Nielsen Norman's page on how to analyze qualitative data from UX research, which was referred to as thematic analysis. TLDR: one can find significant themes (important ideas that reappear throughout data) in qualitative research when tagging observations and quotes with codes.
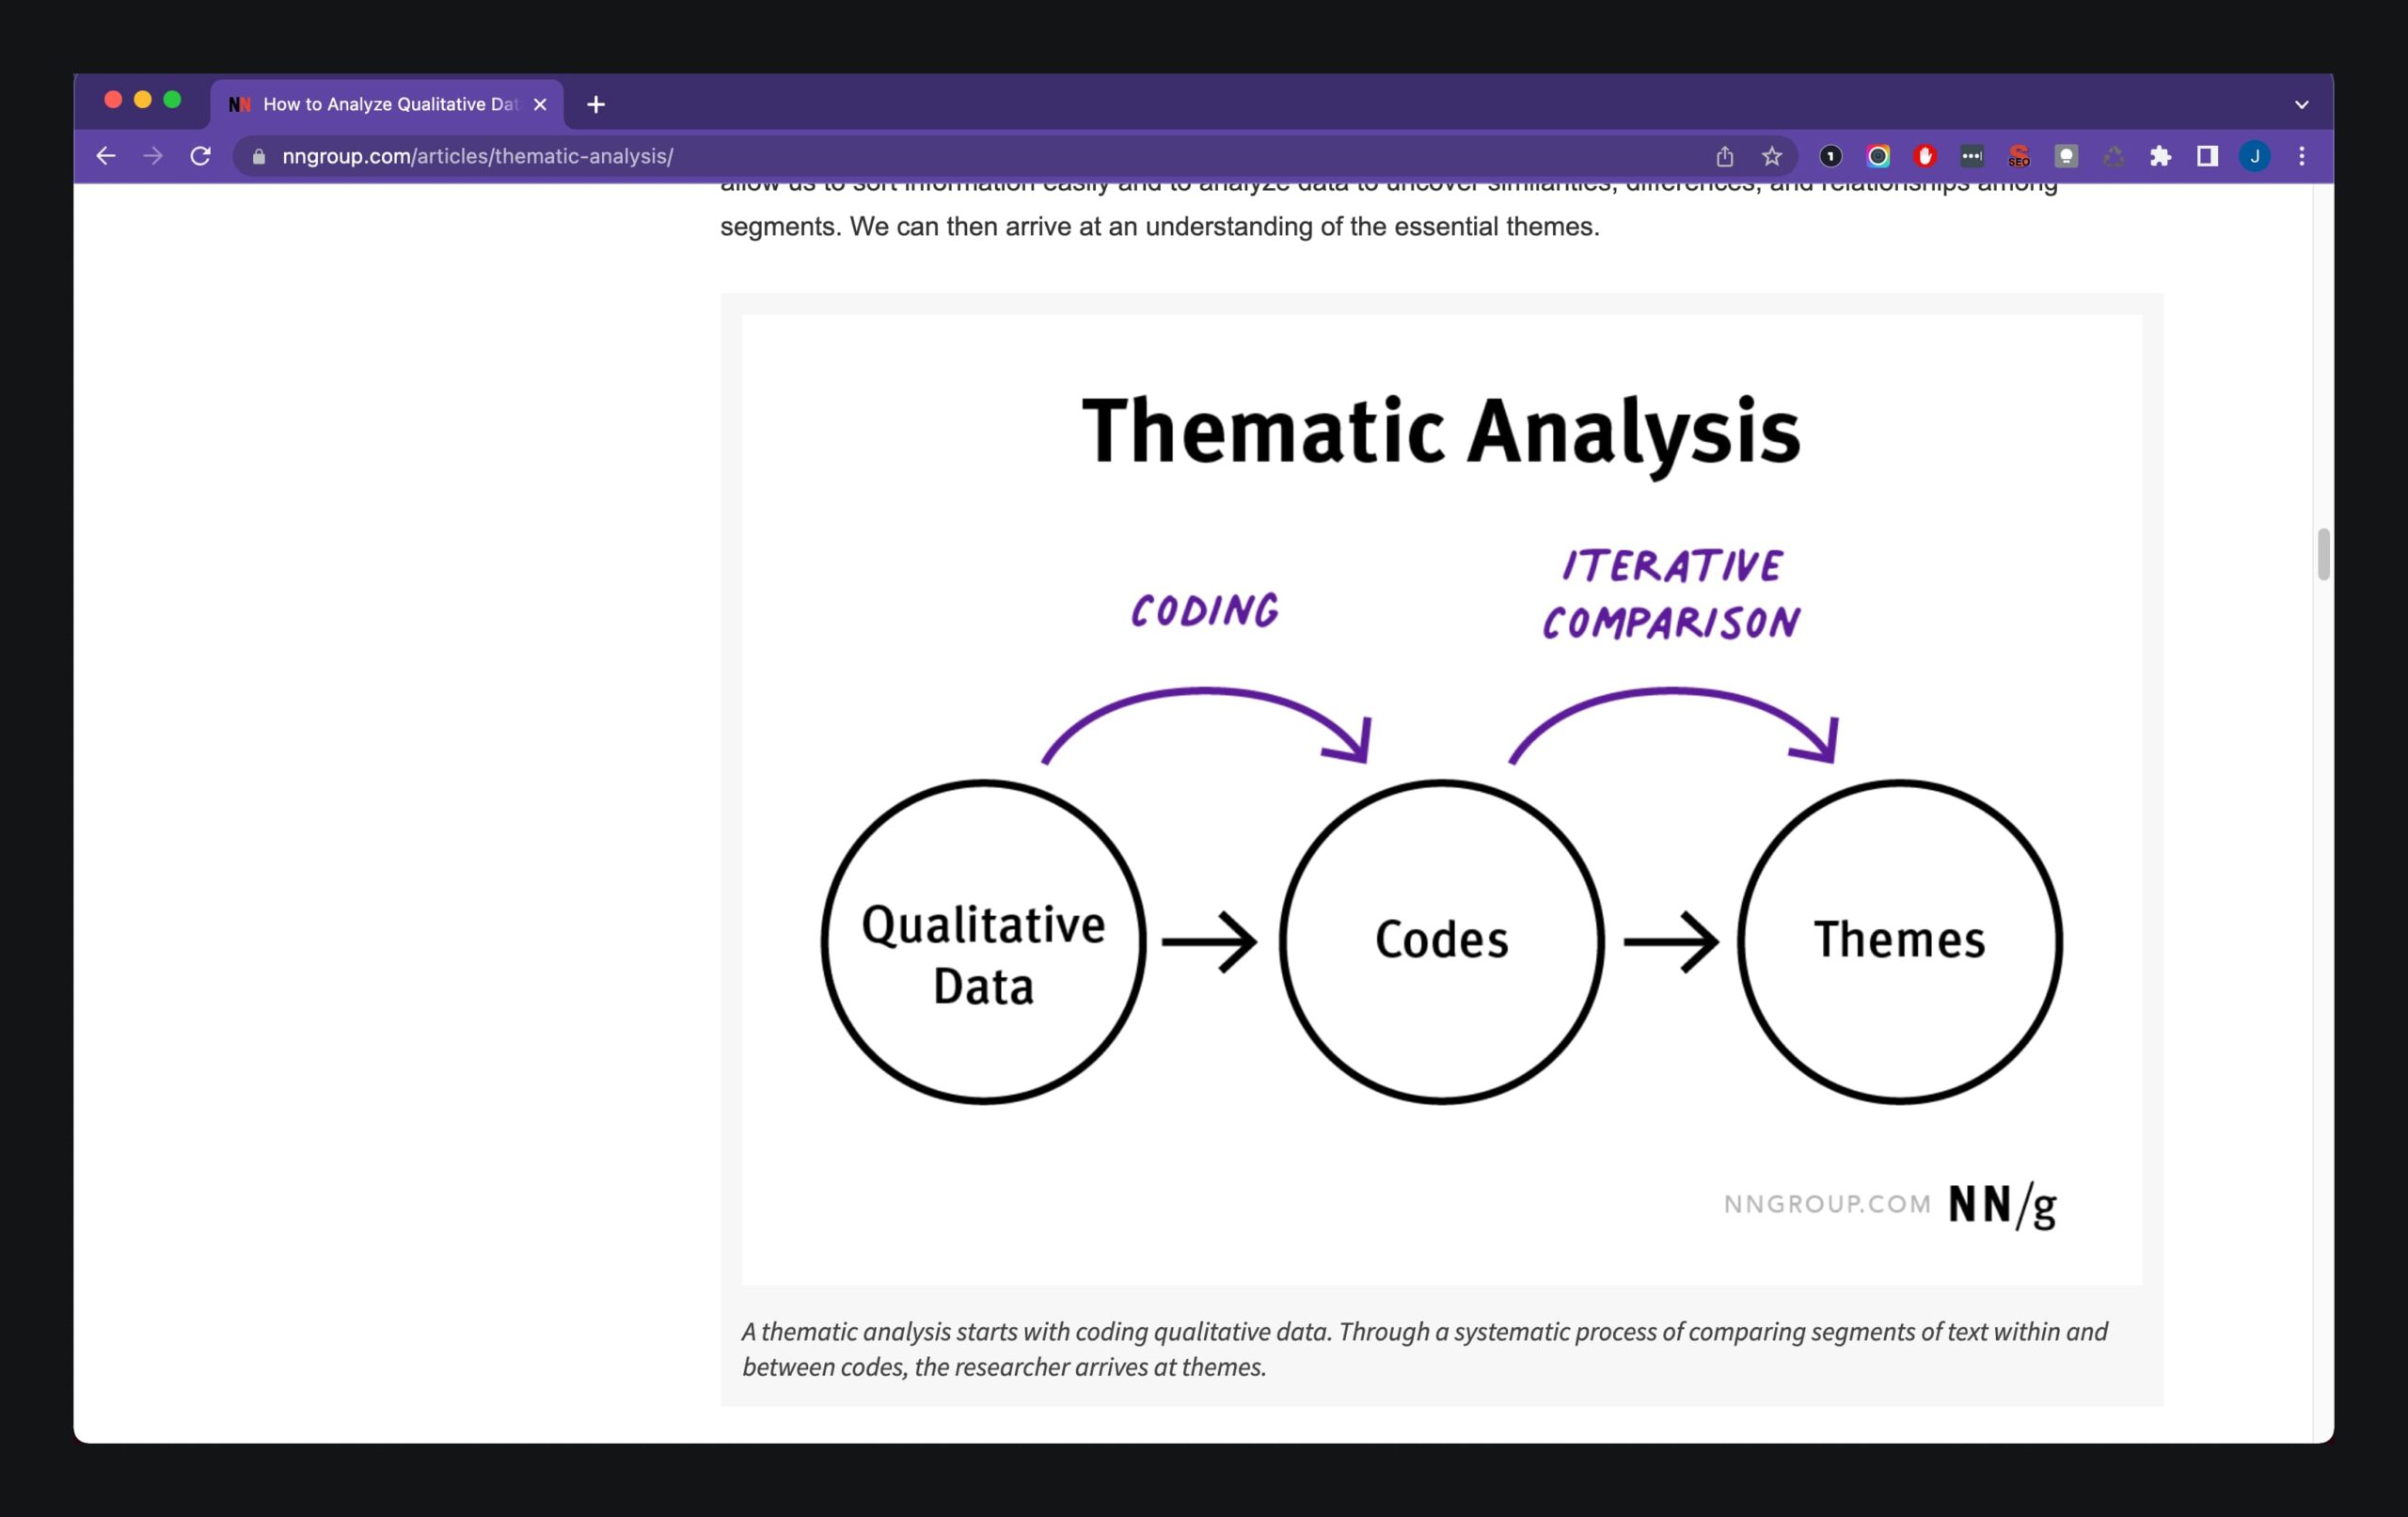
So it looked like codes and a codebook were the key to help us strengthen our user study analysis.
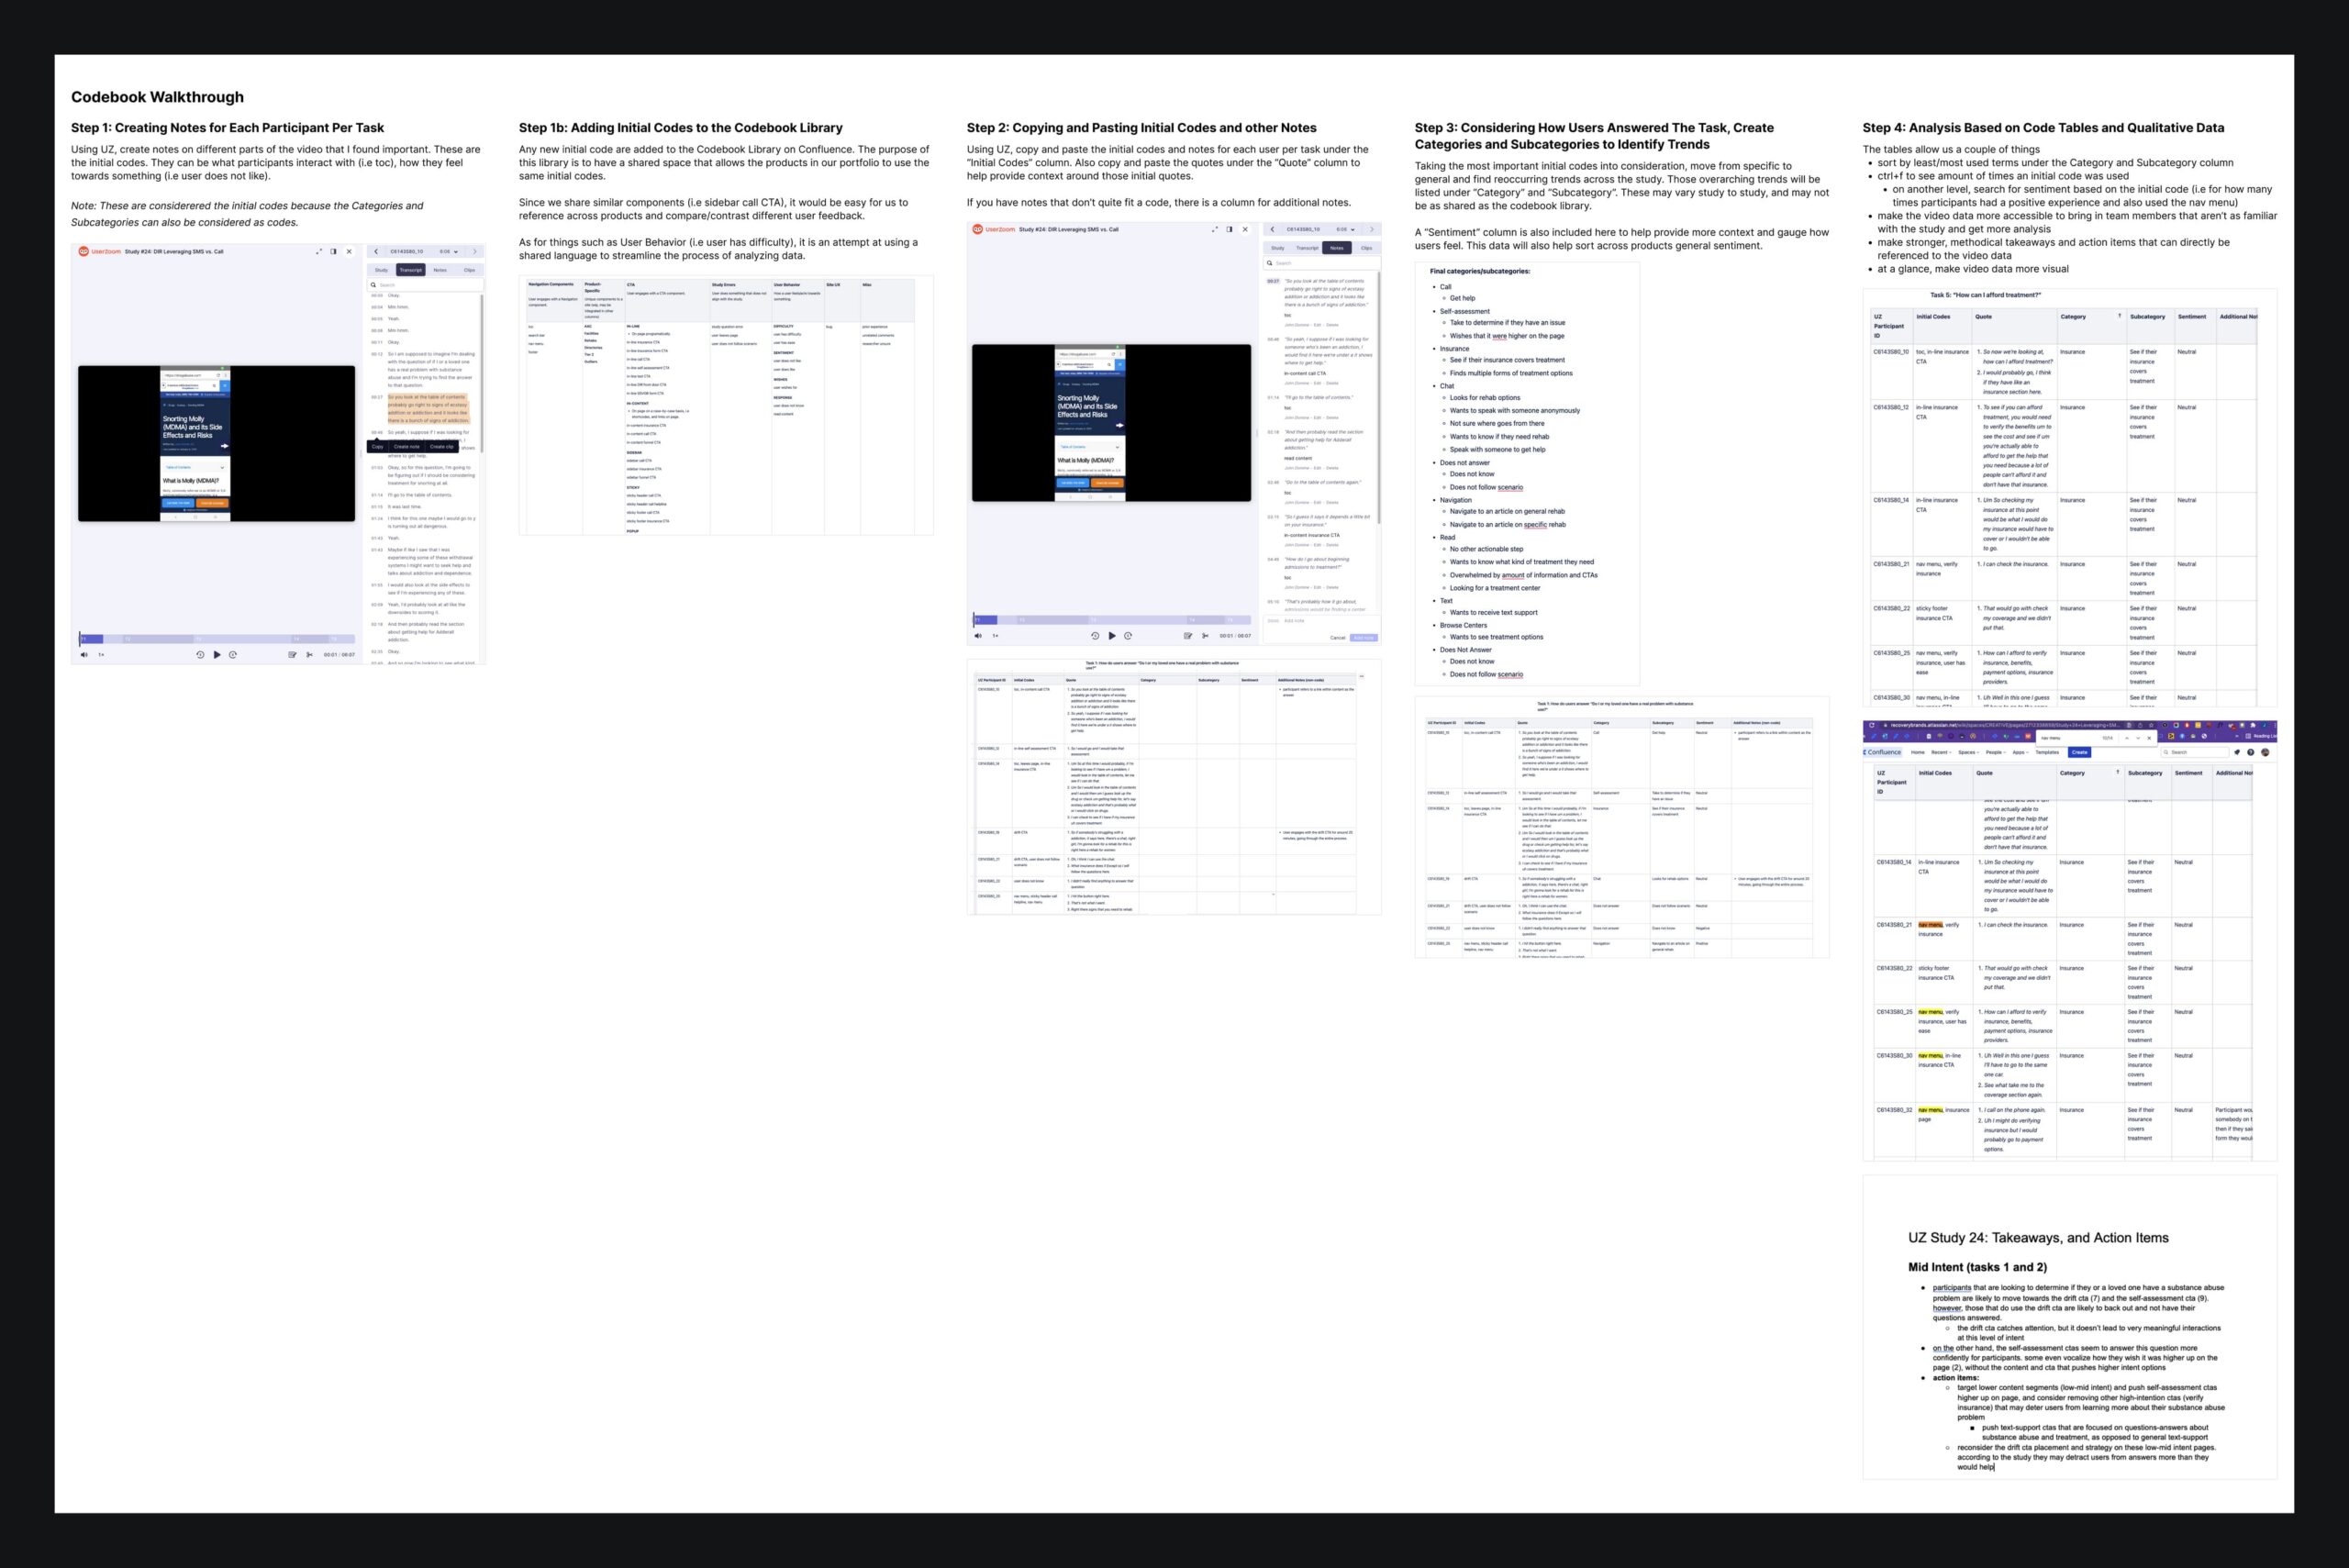
Creating a Codebook
I revisited the literature I found and continued to look for more resources on how to create a codebook. I came up with this general idea on how to approach:

Following this, I decided it was time to try it out myself and started applying this to analyze my fresh user study. I started creating a codebook while adding codes as I saw fit. I made sure to keep in mind scalability, thinking of the other websites in our portfolio and how others would interact with the codebook. Creating a codebook would help us have a shared language as a team for components on our site, i.e table of contents can be referenced as toc.

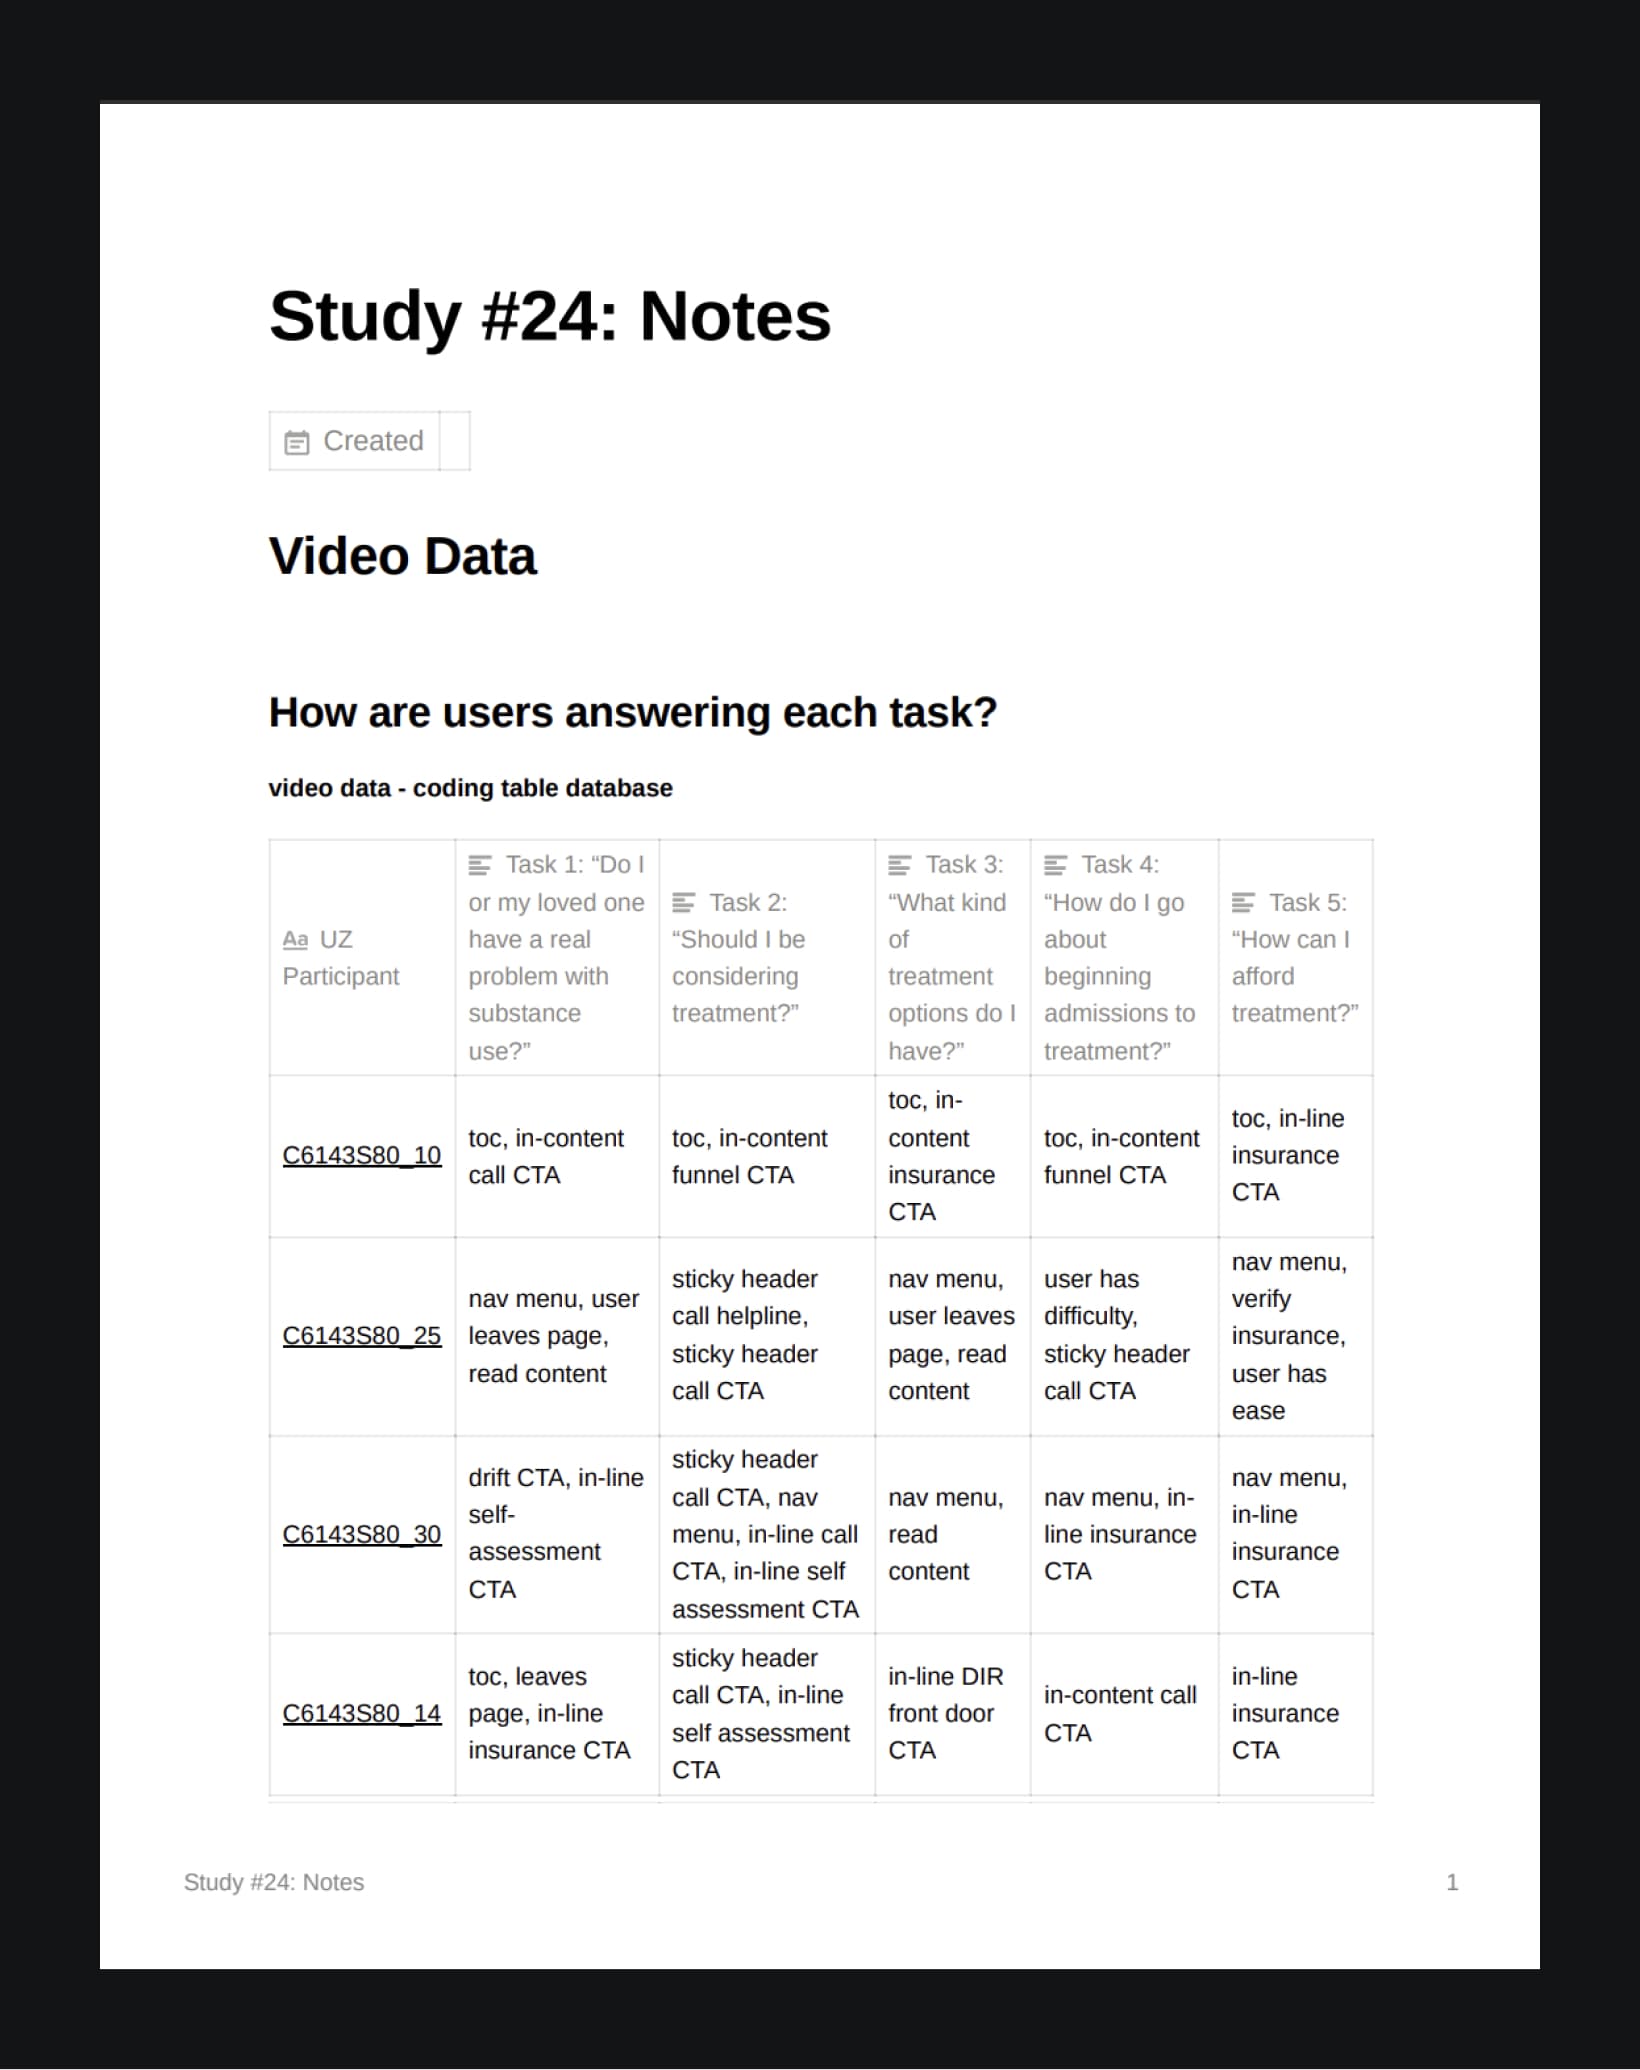
Click on the image above to see the full study notes PDF
After analyzing the study and updating the codebook as best as I could, I documented my process so that others would be able to easily reference it.
Click on the image above to see the full streamline process PDF
Refining the Flow for Our Needs
Inspired by joegrayux.com and nngroup.com, my proposal for the flow was to go from Data -> Analysis -> Observations -> Business Impact. This flow chart helps visualize the process and summarizes how I approached the qualitative coding process.

Buy-Ins
I set some time up to meet with my design manager as well as the product owner that I work with to get their feedback, as well as a potential buy-in to move forward with the process. Both stakeholders were thrilled and excited about the progress that was made. The process could use an easier explanation, and I agreed. I knew that it wasn't perfect, but that was okay. This was a big step in the right direction for our team. The next thing to do would be to get a buy-in from the design team, as they were the primary people going to use this new process.
I prepared a presentation on the new process, and tried to simplify it as best as possible for the design team. I set up some time and went through all of the steps for them, answering questions when necessary. As a team, they all agreed to try this out and apply my process to their next study, and see where there was room for improvement. Another success, I was happy to see that the foundation that I set would be built on and continue to improve.
Finally, we had set up some time to meet with our UserZoom liaison and some product managers and product owners from other teams, and I presented the process to them as well. It went very well, and I was happy to see my work be validated.
Moving Forward
Since this study, we have been utilizing this process and continue to iterate on it. The design team is now focused on finding significant themes within our data, and making our user study analyses accessible to others.
In my document of analysis, I included steps for takeaways and next steps. Now that this step is a part of our streamlined process, action items in the form of design tasks have increased significantly.
With the amount of data available across our products, it made it much easier to see what findings and insights each study had, which in turn led to helping us prevent duplicate efforts in a study. I believe that our team had never felt more connected, with insights and findings spanning across multiple products.
I saw this effort that spanned two weeks a major success and am very proud of the foundation that I set. I admit that it wasn't perfect, especially in that it can appear overwhelming at first glance, but I am thankful for a team to help build off of and improve that foundation.


