
Creating a Codebook

Results at a Glance
- More consistent documentation: Studies were easier to read, skim, and reference
- More actionable outcomes: Each report now included specific insights tied to product goals
- Fewer duplicate studies: Designers could reference past findings and build on them
- Better stakeholder alignment: Product owners didn’t have to watch dozens of videos to understand what users were saying
It also changed how we thought about research. Instead of thinking of each study as a one-off, we started building a library of insights – something reusable, scalable, and searchable.
Problems Faced
We had been doing user studies through our vendor UserZoom for about half a year, but only started to realize that we weren’t using it to it’s fullest potential during Q1 2022.
User studies are excellent ways to gather data from our users: we give people within our user base a controlled scenario to help us understand different perspectives and feedback to help validate or improve our products.

We as a team decided that the studies we’ve been conducting had an abundance of valuable data, but weren’t being utilized efficiently.
- Each designer had a different way of analyzing the studies that they ran, so it made it hard for stakeholders such as Product Owners to go back and come to these same conclusions without spending time reviewing video data.
- Despite the many insights and takeaways that we had, there would not be many actionable items that came from these studies.
- One study would often lead to another study to answer a question from the first study, leading to a huge sink in resources.

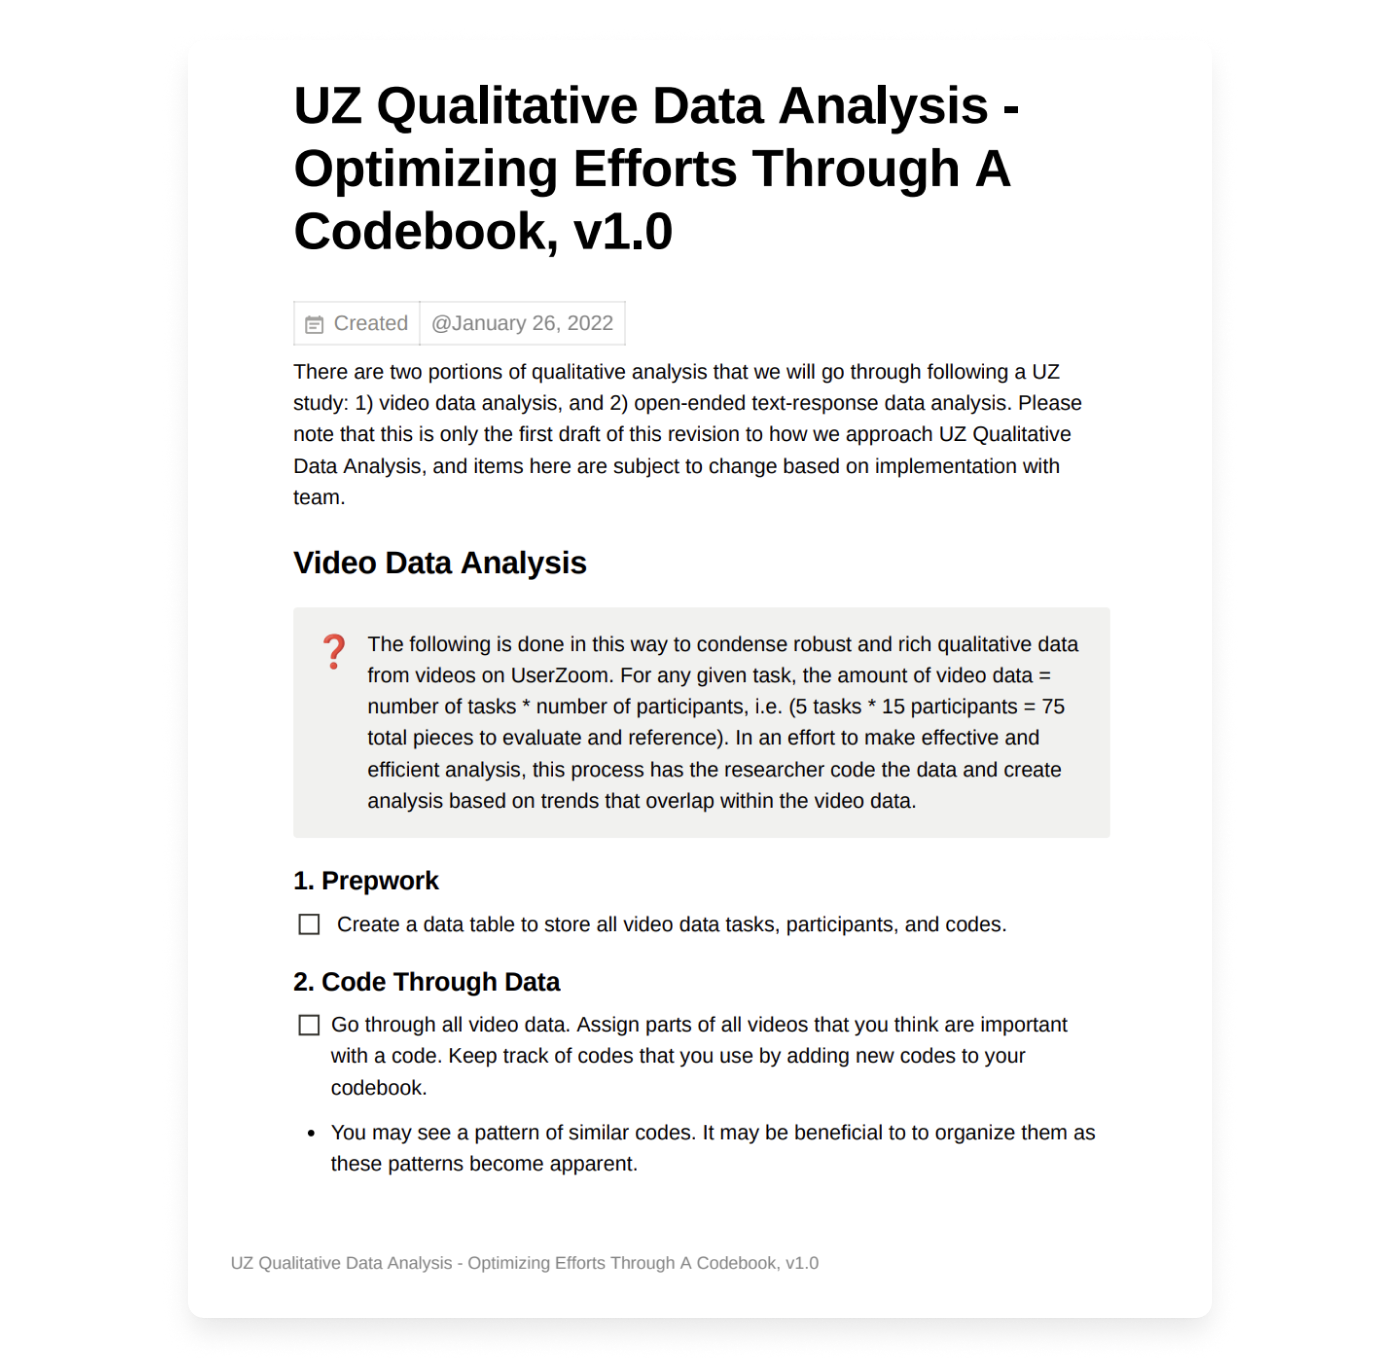
To put into perspective how long it takes to analyze a study: each study took around 15 minutes, and there were minimum 15 participants. Studies were split into different tasks, so each video may have up to 5 different tasks. 15 participants x 5 tasks = 75 individual pieces, 15 participants x 15 minutes = 225 minutes. This doesn’t account for the amount of time rewinding the videos to understand what a user said, or the written responses that are separate from the video data.
During my sprint where my study had just wrapped up and the data was ready to be analyzed, I thought it was the perfect time to try and optimize this process for our team, so I reached out to my design manager and got the green light.
Addressing the Problems
Taking a step back and trying to see the big picture, I considered how to address the problems that we had:
- How might we make it easier for anyone to understand the data that a designer analyzed? Make it intuitive, data should be accessible.
- How might we ensure that valuable action items come out of these studies more often? Make it a goal going into the study to come out with actionable steps for improvement.
- How might we make it more likely that a study will address everything that we want and prevent duplicate efforts? Make it thorough; our questions should cover all the bases, with little room for error.
To solve this problem, we need to make a new streamlined process that is intuitive, action-item-oriented, and thorough. To identify this, I would need to learn more about how to condense a large amount of qualitative data from our user studies.

Researching Qualitative Analysis
I didn’t know much about qualitative analysis until this project, so I took a deep dive online.
I came across this brilliant summary from joegrayux, about his process on how he coded through a dataset of a year’s worth 5000+ text comments. TLDR: Joe had created rough codes that would become more refined and then put into a codebook with a framework to easily understand the data.

I also looked into Nielsen Norman’s page on how to analyze qualitative data from UX research, which was referred to as thematic analysis. TLDR: one can find significant themes (important ideas that reappear throughout data) in qualitative research when tagging observations and quotes with codes.

So it looked like codes and a codebook were the key to help us strengthen our user study analysis.
Creating the Codebook
I revisited the literature I found and continued to look for more resources on how to create a codebook. I came up with this general idea on how to approach:

Following this, I decided it was time to try it out myself and started applying this to analyze my fresh user study. I started creating a codebook while adding codes as I saw fit. I made sure to keep in mind scalability, thinking of the other websites in our portfolio and how others would interact with the codebook. Creating a codebook would help us have a shared language as a team for components on our site, i.e table of contents can be referenced as toc.

After analyzing the study and updating the codebook as best as I could, I documented my process so that others would be able to easily reference it.
So it looked like codes and a codebook were the key to help us strengthen our user study analysis.
Refining the Flow for Our Needs
Inspired by joegrayux.com and nngroup.com, my proposal for the flow was to go from Data -> Analysis -> Observations -> Business Impact. This flow chart helps visualize the process and summarizes how I approached the qualitative coding process.

Team Rollout and Feedback
Once the first version was ready, I shared it with my manager and a product owner to get early feedback. They loved the structure and saw the immediate value in making insights more accessible.
Next, I prepped a walkthrough for the design team. I showed them how the system worked, shared a real example, and explained how it would speed up both analysis and collaboration. They agreed to use the process on their next study – and give feedback so we could keep improving it.
Later, I presented it to our UserZoom liaison and product leaders across other teams. They were excited about the potential to unify how we worked and reduce redundant research across the organization.

Reflection
This was a process project, not a product one, but it reminded me that systems design is still design. It required the same mix of empathy, clarity, structure, and iteration. I wasn’t building a UI, but I was still creating something people needed to use and adopt.
A few takeaways:
- Good research needs good infrastructure
- Even small internal tools can have a big impact when done well
- The more reusable your process, the more powerful your insights become
This project made our research stronger – and it helped us grow as a team. I’m proud that it started from a simple sprint, and ended up shaping how we approach user understanding across products.